One of the things that I have been spending time on lately is getting rid of local authentication in Azure architectures.

Local authentication: authentication using username/password, a key, or another means that does not rely on a central identity provider like Microsoft Entra ID. Using central authentication instead allow you to centrally control which identities can authenticate and perform intrusion prevention and detection centrally.

I’m a big fan of Azure managed identities and how they allow applications to use authentication based on Entra ID, without the need for secrets or certificates. More and more services in Azure support authenticating this way: Storage, CosmosDB, SQL, Data Explorer, Service Bus, I think every service we’ve been using. However, until recently we did not manage to authenticate to Application Insights using a managed identity.

But that’s changed towards the end of 2023 and today I gave it a spin. Spoiler: it works. And to get this working, you have to go through the following steps:

Creating the infrastructure

To get a running application that logs to Application Insights, you will need to create three pieces of infrastructure:

  1. A Web App. I choose to create a new web app and host it on a B1 plan. If leaving this on for a day or two at the most, the cost should stay (way) below $5.
  2. An Application Insights instance. I choose to create a new instance for this project and spend a grant total of $0 hosting this instance for a few days.
  3. An user-assigned managed identity. System-assigned will probably work as well, but I’ve found that user-assigned identities provide just that more flexibility.
    Don’t forget to assign the identity to the web app!

Assigning RBAC roles

As the Application Insights instrumentation key was used for both authentication and authorization, another way for authorization needs to be configured. The way forward here is using Azure RBAC. To allow the managed identity access to Application Insights, configure the role-assignment as follows:

Go the the IAM view on the Application Insights instance and add a new Role-assignment. For the role choose Monitoring Metrics Publisher. Under identities choose the managed identity you created before.

Application configuration

With the infrastructure and authorization configured, let’s writes a simple C# app that proves that an application can log to Application Insights without using an instrumentation key. Create a new ASP.NET MVC application by clicking next, next, finish and make the following changes:

  1. Install the Application Insights NuGet package.
  2. Next, configure the connection string (without an instrumentation key) in your appsettings.json:
{
  "Logging": {
    "LogLevel": {
      "Default": "Information",
      "Microsoft.AspNetCore": "Warning"
    }
  },
  "AllowedHosts": "*",
  "ApplicationInsights": {
    "ConnectionString": "InstrumentationKey=00000000-0000-0000-0000-000000000000;IngestionEndpoint=https://westeurope-5.in.applicationinsights.azure.com/;"
  }
}
  1. In the start-up of the application, in Program.cs add the following code to configure authentication using Managed Identity:
builder.Services.AddApplicationInsightsTelemetry();

builder.Services.Configure<TelemetryConfiguration>(config =>
{
    var credential = new DefaultAzureCredential(new DefaultAzureCredentialOptions
    {
        ManagedIdentityClientId = "14c20300-5af3-4f33-88fa-004ed7a71140"
    });
    config.SetAzureTokenCredential(credential);
});

The guid you see here is the client id of your managed identity. In a real world application you would get this from your configuration.

  1. You can verify you configured everything correctly by starting the application locally and viewing the Application Insights local telemetry. It should look something like this:


Disabling local authentication

To proof that we are really using Managed Identity or local developer identity for logging and to remove the risk that a leaked connection string can be misused, we can actively disable local authentication on the Application Insights instance. To do this, open Application Insights in the portal, navigate to the properties view (way down) and click local authentication at the bottem of the properties page:

If you click the link, a new view opens where you can enable or disable local authentication and read up on the consequences if you feel unsure.

Running the application

  1. Deploy the application to your App Service
  2. Wait for the deployment to complete and open the live metrics view in Application Insights.
  3. Refresh your page a few times and observe metrics and logs flowing in:

Voila! A completely passwordless connection from your application code into Application Insights!


In response to my post on tracking bugs using Azure DevOps, I got a question about tracking different types of bugs. As the question was in writing, I’m going to answer it here to -hopefully- help explain my view on tracking bugs in more detail.

Question (slightly edited)

I see a difference between three types of bugs:

  1. Bugs that are discovered when testing a user-story.
  2. Bugs that are discovered when testing a user-story, but are very important (for example an unexpected app shutdown).
  3. Bugs in production that are related to an epic closed a long time ago.

In the first case I would create a new task to deal with the problem encountered. In the second case I would then add an Impediment object to the sprint backlog. And finally, in the third case, I would create an actual bug and track it on the backlog. Now we are organizing our user stories in features and our features in epics. So.., where in this hierarchy should I place this bug? Should I create an epic called “Bugs” with the feature “Bugs” under it, and then add the bug under that feature?

Answer

How to track bugs that are not part of the in-progress work is a question I have encountered at different clients. To answer it, I think we must further differentiate between two groups of bugs that make up this third category:

  1. Bugs in production that we are tracking in a bug-tracking capacity. F.e. to allow customers to vote on them, publish workarounds, etc. Some of these bugs might be part of the product for years, but haven’t been fixed and will probably never be fixed.
  2. Bugs in production that we are tracking because we want to work on them. F.e. bugs that we want to fix in the next sprint or ‘somewhere this quarter.’

If you already have a system for tracking this first category, you probably don’t want to duplicate all the bugs from there into Azure DevOps. But, if you haven’t such a system, it makes sense to track these bugs in Azure DevOps instead and yes, I would then all add them under a feature ‘Known Bugs,’ under an epic ‘Known Bugs.’ But again, if you are using a CRM, GitHub issues or bug-tracking software for recording and detailing bugs, it doesn’t really make sense to me to duplicate all these bugs into Azure DevOps.

The second category is different, these bugs I would duplicate to Azure DevOps (or even better, link to that bug from within Azure DevOps to avoid spreading information related to the bug over two systems.) So how to link these to features and epics? For me it is important that epics and features are ‘done’ at some point, so a general epic or feature ‘bugs to fix’ doesn’t really make sense to me. Instead I would propose to create features like this: ‘Bugs Sprint 101,’ ‘Bugs Sprint 102,’ etc etc, and plan these features for the mentioned sprint. We then connect the bugs we duplicate from the bug-tracker, to the feature, and we are suddenly in planning mode. These features I would then group under features called ‘LCM 2022Q3,’ ‘LCM 2022Q4,’ etc etc. This provides a good overview of which bugs we will be fixing when. Yet, I wouldn’t plan more than 1 or 2 sprints ahead myself.

The added benefit of this system is that it allows you to plan other life cycle management (LCM) work as well. Let’s say you are facing an upgrade to .NET6, the latest version of Angular, or you need to remove a dependency on a duplicated library in 8 projects. As fixing right away is not always possible, you know have the epics in place to plan your LCM work ahead as well.

PS

Tracking a bug that introduces a critical regression as an impediment instead of a bug (the second case) is something that can be debated. Personally, I don’t think I see the difference between the first and second type of bug. However, this may vary from context to context. I would be curious to learn when this would make sense.

After almost a year without in-person events, this February was supposed to be the day that I went out again to speak, for starters, at a hybrid event: 4DotNet Conf. Unfortunately, the ongoing Covid-19 situation forced the organizers to switch to a fully remote event in the end. Still, the event went on and was as interactive as possible. I had fun talking to Eduard again and presented the challenges of building a distributed system to about 270 people.

For those interested in my slides, they are available for download. There is also a recording that is available on YouTube.Throughout the talk, I have also shown some code left and right. You can find the full demonstration application on GitHub.

If you are writing software applications and you take that seriously, it is very likely that you are also investing a constant percentage of your time in writing automated tests for your system. When you start out on this journey, you are -rightfully- focusing on unit tests. They are quick to write, quick to run and can be integrated with your build and deployment pipelines easily.

But when you come further down the road, you find that you need other types of tests as well: tests with a large scope like integration tests and systems. My definition of these two types of tests are these:

  1. Integration tests tests with a medium scope that run to verify if my assumptions and expectations regarding an external component are (still) true. The scope for this type of test is often one class (or a few classes) in my own codebase and an instance of the external system. These tests run much slower than unit tests, but also much faster than system tests. A typical execution takes around 1 second.
  2. System tests are tests with a large scope that run against a deployed version of my application. These tests run to verify if the system is correctly deployed and configured and if the most critical of flows are supported. These tests are the slowest of them all and execution can take anything between a few seconds (API test) up to a few minutes (UI test) I try to avoid writing them whenever I can.

In this post I want to share what I have come to view as good integration tests for verifying if my application code integrates with external systems correctly. I write these tests often as I find that they help me reason about how I want to integrate with external systems and help me identify and prevent all kinds of nitty-gritty issues that otherwise would have come to surface only after a deployment to test, during manual and/or system tests. I also use these tests for constantly verifying assumptions that I have about my (abstractions of) external systems. They help me detect changes in systems I integrate with, hopefully helping me to prevent integration issues.

Typical examples are:

  1. Code for reading from or writing to a messaging system like a topic or a queue
  2. Code for reading or writing data from an database
  3. Interactions with the file system or the current date and/or time

In the remainder I will take #2 as an example, as I believe it is an example we can all relate to.

Defining the abstraction

Integration points should be as thin as possible, to do this a right abstraction must be chosen: an interface that is as small as possible, yet captures all the dependencies your system has on the other system. Luckely, for many situations there are well-known abstractions. A prime example is the Repository-pattern for abstracting data stores. So in this example, let’s say I have an interface like this:

public interface IRecipesRepository
{
    Task AddAsync(Recipe recipe);
    Task<Recipe> GetByIdAsync(Guid id);
}

In my unit tests this is a simple and easy interface to mock away allowing me to effectively unit test my other classes, without the need to connect to the database.

Of course, it also forces me to write an implementation. Let’s assume something like this:

public class RecipesRepository : IRecipesRepository
{
    private readonly IOptions<CosmosConfiguration> _cosmosConfiguration;

    public RecipesRepository(IOptions<CosmosConfiguration> cosmosConfiguration)
    {
        _cosmosConfiguration = cosmosConfiguration;
    }

    public async Task AddAsync(Recipe recipe)
    {
        await GetContainer().UpsertItemAsync(recipe, new PartitionKey(recipe.Id.ToString()));
    }

    public async Task<Recipe> GetByIdAsync(Guid id)
    {
        var query= new QueryDefinition("SELECT * FROM c WHERE c.id = @id")
            .WithParameter("@id", id.ToString());

        var results = await GetContainer().GetItemQueryIterator<Recipe>(query).ToArrayAsync();

        if (!results.Any())
        {
            throw new RecipeNotFoundException();
        }

        return results.Single();
    }

    private CosmosContainer GetContainer()
    {
        var client = new CosmosClient(
            _cosmosConfiguration.Value.EndpointUrl, 
            _cosmosConfiguration.Value.AuthorizationKey);

        return client.GetContainer(
            _cosmosConfiguration.Value.RecipeDatabaseName, 
            _cosmosConfiguration.Value.RecipeContainerName);
    }
}

And with the primary code in hand, let’s take a look at writing a first iteration of the test.

Writing a first test

A first test incarnation of a class for testing the implementation would be something like this:

[TestFixture]
public class RecipesRepositoryTest
{
    [Test]
    public async Task WhenStoringARecipe_ThenItCanBeReadBack()
    {
        // Arrange
        var configuration = new CosmosConfiguration()
        {
            EndpointUrl = "https://integrationtestingexternalsystems.documents.azure.com:443/",
            AuthorizationKey = "GjL...w==",
            RecipeDatabaseName = "testDatabase",
            RecipeContainerName = "testRecipes"
        };

        var repository = new RecipesRepository(Options.Create(configuration));
        var expected = new Recipe("my Recipe");

        // Act
        await repository.AddAsync(expected);
        var actual = await repository.GetByIdAsync(expected.id);

        // Assert
        Assert.AreEqual(expected.Name, actual.Name);
    }
}

At first this looks like a proper test. It is nicely split into three parts: the arrange, act and assert. It tests one thing and it tests one thing only, so when it fails it is pretty clear what requirement is not being met and it is most likely pinpointing the cause pretty good. is also not to long, which means that it is very readable and understandable. However, it does have some downsides, which will become more clear when we add a second test.

Please note: we will get to the part where we strip out the secrets later on.

Writing a second test

After the first test, I have now added a second test. This makes that my test class now looks like this:

[TestFixture]
public class RecipesRepositoryTest
{
    [Test]
    public async Task WhenStoringARecipe_ThenItCanBeReadBack()
    {
        // Arrange
        var configuration = new CosmosConfiguration()
        {
            EndpointUrl = "https://integrationtestingexternalsystems.documents.azure.com:443/",
            AuthorizationKey = "GjL...w==",
            RecipeDatabaseName = "testDatabase",
            RecipeContainerName = "testRecipes"
        };

        var repository = new RecipesRepository(Options.Create(configuration));
        var expected = new Recipe("my Recipe");

        // Act
        await repository.AddAsync(expected);
        var actual = await repository.GetByIdAsync(expected.id);

        // Assert
        Assert.AreEqual(expected.Name, actual.Name);
    }

    [Test]
    public void WhenAnRecipeIsRequested_AndItDoesNotExist_ThenItThrowsRecipeNotFoundException()
    {
        // Arrange
        var configuration = new CosmosConfiguration()
        {
            EndpointUrl = "https://integrationtestingexternalsystems.documents.azure.com:443/",
            AuthorizationKey = "GjL...w==",
            RecipeDatabaseName = "testDatabase",
            RecipeContainerName = "testRecipes"
        };

        var repository = new RecipesRepository(Options.Create(configuration));

        // Act
        AsyncTestDelegate act = async () => await repository.GetByIdAsync(Guid.NewGuid());

        // Assert
        Assert.ThrowsAsync<RecipeNotFoundException>(act);
    }
}

With this second test in there, it becomes much more evident that it is time to make some changes. First of all, we can see that there is some repetition going on at the start of each test. Let’s use refactor the test class a little bit to use the SetUp attribute to centralize the repeated parts into a method that is executed again before every test. This yields a result like this:

[TestFixture]
public class RecipesRepositoryTest
{
    private RecipesRepository repository;

    [SetUp]
    public void SetUp()
    {
        var configuration = new CosmosConfiguration()
        {
            EndpointUrl = "https://integrationtestingexternalsystems.documents.azure.com:443/",
            AuthorizationKey = "Gj...w==",
            RecipeDatabaseName = "testDatabase",
            RecipeContainerName = "testRecipes"
        };

        repository = new RecipesRepository(Options.Create(configuration));
    }

    [Test]
    public async Task WhenStoringARecipe_ThenItCanBeReadBack()
    {
        // Arrange
        var expected = new Recipe("my Recipe");

        // Act
        await repository.AddAsync(expected);
        var actual = await repository.GetByIdAsync(expected.id);

        // Assert
        Assert.AreEqual(expected.Name, actual.Name);
    }

    [Test]
    public void WhenAnRecipeIsRequested_AndItDoesNotExist_ThenItThrowsRecipeNotFoundException()
    {
        // Act
        AsyncTestDelegate act = async () => await repository.GetByIdAsync(Guid.NewGuid());

        //Assert
        Assert.ThrowsAsync<RecipeNotFoundException>(act);
    }
}

However, the test is still not perfect. The main problem with this test is that it executes over and over again against the same test database and test container. This means that these will grow and grow over time, which is not good. For two reasons:

  1. It makes any failure hard to troubleshoot. If this test fails the 10.000th time it executes, there will be 10.000 records to go through to see what’s happening. It will be hard to say what the reason for the failure is: is the record is not stored at all? is the name field not correctly saved? is the name field not correctly deserialized? is the whole thing not read while it is in the database? or any other of many possible scenario’s. A failed test is so much easier to troubleshoot if there are only the records I need for this test, and no more.
  2. If I reuse this container for an ever growing number of tests, at some point there will be tests that leave recipes that influence other tests. Test runs will have side-effects on the test-data available to other tests. Which means that tests will start to interfere with each other, which is really, really bad. If such a thing starts happening, it will most likely result in a few random tests starting to fail in every test run. Often different tests in every run as well. Hard to troubleshoot and very hard to fix. (By the way: if you are ever tempted to fix such a problem by imposing an order among the tests: don’t. Instead make all tests independent of each other and free of side-effects again.)

The best way to prevent all these problems is simply to create an isolated Cosmos DB container for each test. One way for effectively managing that, is using a test context. A test context is a concept that we introduce to capture everything that surrounds the test, but is strictly speaking not a part of the test itself.

Extracting a test context class

Test contexts are classes that I write for supporting my tests with capabilities that are needed, but not part of the test self. In this case, we will need a class that can be used to do the following:

  1. Create a new CosmosDB container for every test
  2. Remove that container after the test completes
  3. Provide relevant information or configuration to my tests, when needed

A test context class for testing a repository that runs against a cosmos container, might look something like this:

public class CosmosDbRepositoryTestContext
{
    private CosmosConfiguration _configuration;
    private CosmosContainer _container;

    public async Task SetUpAsync()
    {
        _configuration = new CosmosConfiguration()
        {
            EndpointUrl = "https://integrationtestingexternalsystems.documents.azure.com:443/",
            AuthorizationKey = "GjL...w==",
            RecipeDatabaseName = "testDatabase",
            RecipeContainerName = $"integrationtest-{Guid.NewGuid()}"
        };

        var cosmosclient = new CosmosClient(_configuration.EndpointUrl, _configuration.AuthorizationKey);
        var database = cosmosclient.GetDatabase(_configuration.RecipeDatabaseName);
        var containerResponse = await database.CreateContainerIfNotExistsAsync(
            _configuration.RecipeContainerName, "/id");
        _container = containerResponse.Container;
    }

    public async Task TearDownAsync()
    {
        await _container.DeleteContainerAsync();
    }

    public CosmosConfiguration GetCosmosConfiguration()
    {
        return _configuration;
    }
}

Here we can see that, instead of reusing the same collection over and over, I am creating a new collection within the context. The context also provides capabilities for getting the reference to that container and the means for cleaning up. Now you might wonder, why a separate class? Why not execute this fairly limited amount of code from the test class itself? The reason is quite simple: reuse. If I want to implement more repository classes, they are also going to depend on an CosmosConfiguration for instantiation. That means that I can reuse this test context for all my repositories that work with CosmosDB.

Having this context, means that my test class itself can now focus on the actual test execution itself:

[TestFixture]
public class RecipesRepositoryTest
{
    private CosmosDbRepositoryTestContext _cosmosDbRepositoryTestContext;
    private RecipesRepository _repository;

    [SetUp]
    public async Task SetUp()
    {
        _cosmosDbRepositoryTestContext = new CosmosDbRepositoryTestContext();
        await _cosmosDbRepositoryTestContext.SetUpAsync();

        _repository = new RecipesRepository(
            Options.Create(_cosmosDbRepositoryTestContext.GetCosmosConfiguration()));
    }

    [TearDown]
    public async Task TearDown()
    {
        await _cosmosDbRepositoryTestContext.TearDownAsync();
    }

    [Test]
    public async Task WhenStoringARecipe_ThenItCanBeReadBack()
    {
        // Arrange
        var expected = new Recipe("my Recipe");

        // Act
        await _repository.AddAsync(expected);
        var actual = await _repository.GetByIdAsync(expected.id);

        // Assert
        Assert.AreEqual(expected.Name, actual.Name);
    }

    [Test]
    public void WhenAnRecipeIsRequested_AndItDoesNotExist_ThenItThrowsRecipeNotFoundException()
    {
        // Act
        AsyncTestDelegate act = async () => await _repository.GetByIdAsync(Guid.NewGuid());

        //Assert
        Assert.ThrowsAsync<RecipeNotFoundException>(act);
    }
}

Now that we have all the ceremony moved to the test context, let’s see if we can get rid of that nasty hardcoded CosmosConfiguration.

Extracting a settings file

NUnit, the testing framework I use here, supports the use of runsettings files. These files can be used for capturing all the settings that are used throughout the tests. To reference a setting from such a file, the following syntax can be used: TestContext.Parameters["settingName"]Here TestContext does not reffer to my own work, but to the test context that NUnit provides, including access to the settings. Inserting this into our own CosmosDbRepositoryTestContext class will yield the following:

public class CosmosDbRepositoryTestContext
{
    private CosmosConfiguration _configuration;
    private CosmosContainer _container;

    public async Task SetUpAsync()
    {
        _configuration = new CosmosConfiguration()
        {
            EndpointUrl = TestContext.Parameters["EndpointUrl"],
            AuthorizationKey = TestContext.Parameters["AuthorizationKey"],
            RecipeDatabaseName = TestContext.Parameters["RecipeDatabaseName"],
            RecipeContainerName = $"integrationtest-{Guid.NewGuid()}"
        };

        var cosmosclient = new CosmosClient(_configuration.EndpointUrl, _configuration.AuthorizationKey);
        var database = cosmosclient.GetDatabase(_configuration.RecipeDatabaseName);
        var containerResponse = await database.CreateContainerIfNotExistsAsync(
            _configuration.RecipeContainerName, "/id");
        _container = containerResponse.Container;
    }

    public async Task TearDownAsync()
    {
        await _container.DeleteContainerAsync();
    }

    public CosmosConfiguration GetCosmosConfiguration()
    {
        return _configuration;
    }
}

And to provide values for the test, a runsettings file has to be created. I always create two of them, the first one goes in my solution and looks like this:

<?xml version="1.0" encoding="utf-8"?>
<RunSettings>
  <TestRunParameters>
    <Parameter name="EndpointUrl" value="#{EndpointUrl}#" />
    <Parameter name="AuthorizationKey" value="#{AuthorizationKey}#" />
    <Parameter name="RecipeDatabaseName" value="#{RecipeDatabaseName}#" />
  </TestRunParameters>
</RunSettings>

In this file I provide all the values that are needed when running the tests from a pipeline, excluding the secrets and any values that are dependent on the infrastructure creation. For these values I insert placeholders that I will later replace using a task in the pipeline. This way I ensure that my integration tests always use the infrastructure created earlier and that secrets can be stored securely and not in source control. Besides this file that is in source control, I will also make a similar file on my local computer in a secure location that contains the actual values for testing from my own, personal machine. To run the test using this file, I use the Test Explore and configure a runsettings file like this:

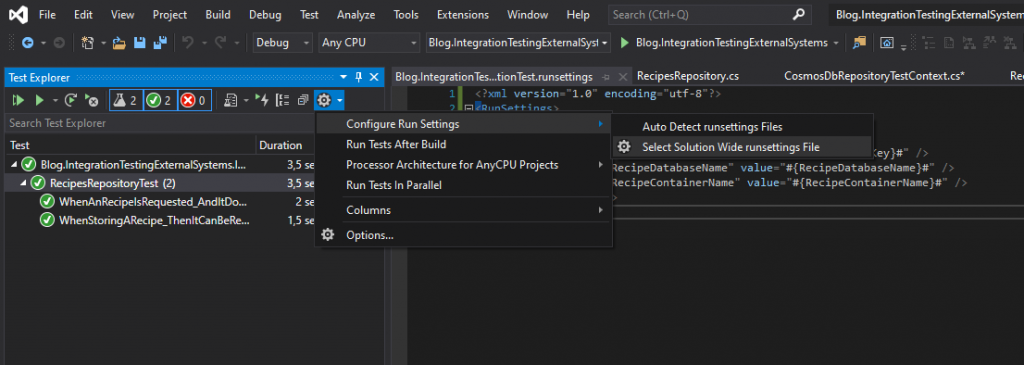
And with this final change we have removed settings and secrets and are still able to run our test while having prepared for running them from a pipeline as well.

Running integration tests from an pipeline

No blog regarding testing is complete without showing how to do it from a pipeline. In this case I want to show a pipeline consisting out of four tasks:

  1. A task that deploys an ARM template that creates an CosmosDB account and a database for testing in that account. The template also produces a number of outputs;
  2. A task that retrieves the outputs from task #1 and makes them available as pipeline variables;
  3. A task that read the runsettings file and replaces the tokens with the outputs retreived in task #2;
  4. Finally, a task is run that executes the integration test, passing in the correct runsettings file.

As all pipelines in Azure DevOps are YAML nowadays, the following shows how this can be done.

trigger:
- master

variables:
  BuildConfiguration: 'Release'
  ServiceConnectionName: 'CDforFunctionsX'
  ResourceGroupName: 'Blog.IntegrationTestingExternalSystems'
  ResourceGroupLocation: 'West Europe'
  EnvironmentName: 'test'

steps:
- task: AzureResourceGroupDeployment@2
  displayName: 'ARM template deployment'
  inputs:
    azureSubscription: $(ServiceConnectionName)
    resourceGroupName: $(ResourceGroupName)
    location: $(ResourceGroupLocation)
    csmFile: '$(System.DefaultWorkingDirectory)/Blog.IntegrationTestingExternalSystems.Deployment/armtemplate.json'
    overrideParameters: '-environmentName "$(EnvironmentName)"'
    deploymentMode: 'Incremental'

- task: keesschollaart.arm-outputs.arm-outputs.ARM Outputs@5
  displayName: 'Fetch ARM Outputs'
  inputs:
    ConnectedServiceNameARM: $(ServiceConnectionName)
    resourceGroupName:  $(ResourceGroupName)

- task: qetza.replacetokens.replacetokens-task.replacetokens@3
  displayName: 'Replace tokens in Blog.IntegrationTestingExternalSystems.IntegrationTest.runsettings'
  inputs:
    targetFiles: '$(System.DefaultWorkingDirectory)/Blog.IntegrationTestingExternalSystems.IntegrationTest/Blog.IntegrationTestingExternalSystems.IntegrationTest.runsettings'

- task: UseDotNet@2
  inputs:
    packageType: 'sdk'
    version: '3.1.403'

- task: DotNetCoreCLI@2
  displayName: 'Compile sources'
  inputs:
    command: 'build'
    projects: '**/*.csproj'
    arguments: '--configuration $(BuildConfiguration)'

- task: DotNetCoreCLI@2
  displayName: 'Run integration tests'
  inputs:
    command: 'custom'
    custom: 'vstest'
    projects: '$(Build.SourcesDirectory)/Blog.IntegrationTestingExternalSystems.IntegrationTest\bin\$(BuildConfiguration)\netcoreapp3.1\Blog.IntegrationTestingExternalSystems.IntegrationTest.dll'
    arguments: '--settings:$(Build.SourcesDirectory)/Blog.IntegrationTestingExternalSystems.IntegrationTest/Blog.IntegrationTestingExternalSystems.IntegrationTest.runsettings'

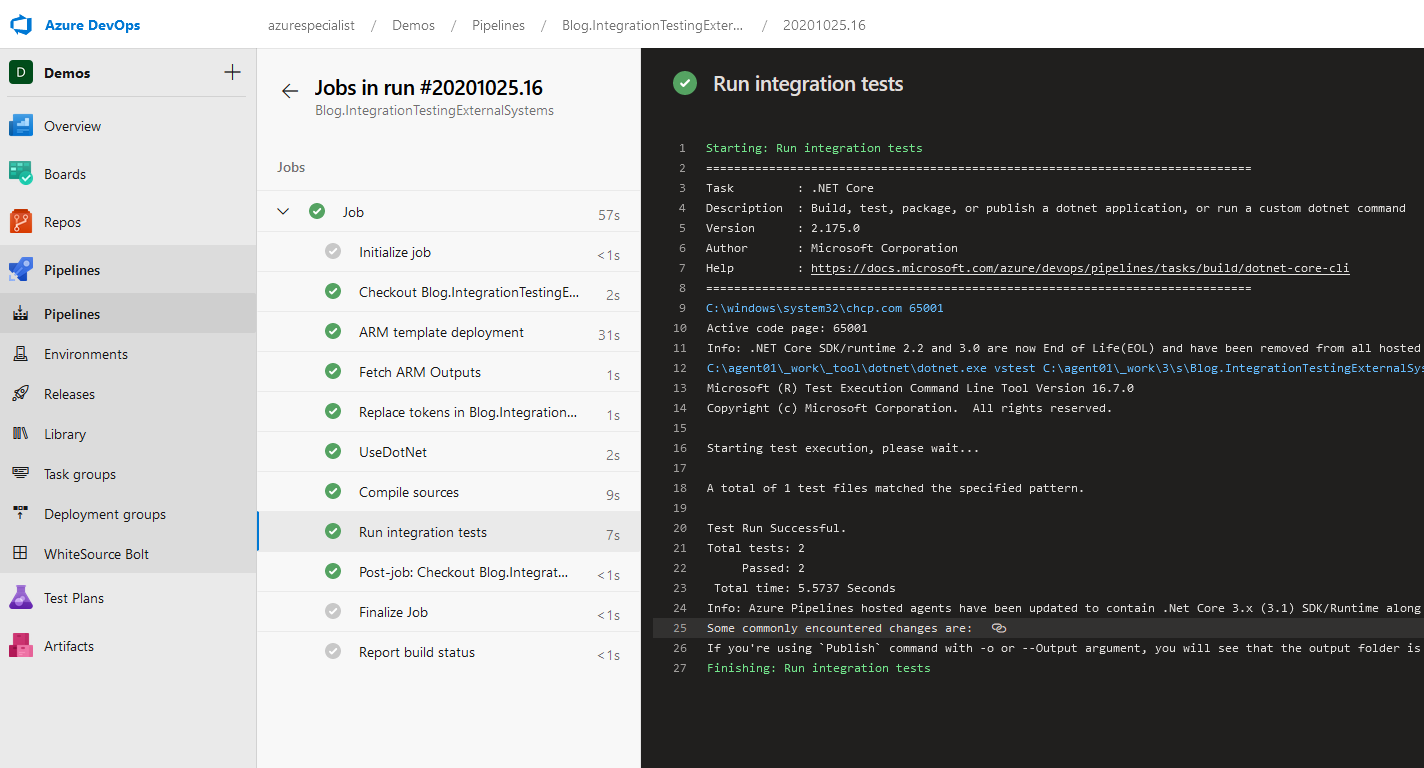
And to prove that this works, here a screenshot of the execution of this pipeline, publishing a successful test!

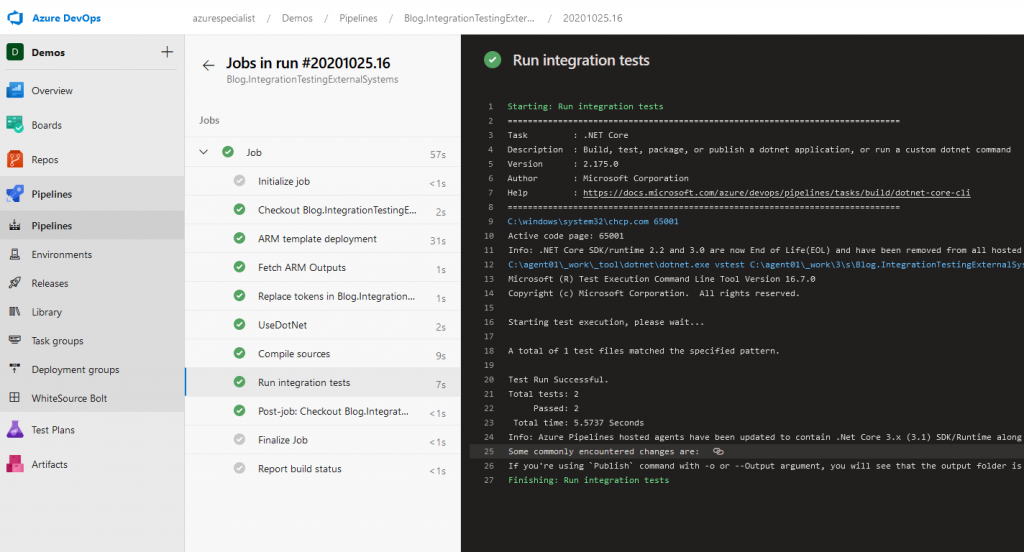
And that completes this example! I hope I have shown you how to create valuable, maintainable integration tests for verifying your integration exceptions regarding other systems and how to re verify those using tests that can run in your CI pipelines in a repeatable and reliable way.

The complete example can be found at https://github.com/henrybeen/Blog.IntegrationTestingExternalSystems/

Happy coding!

One of the things that makes Azure DevOps so great is the REST API that comes with it. This API allows you to do almost all the things that you can do through the interface. Unfortunately, it is sometimes a bit behind in functionality when comparing it to the interface. Especially in edge cases or when looking at the newest features, support for these features has sometimes not lighted up in the REST API yet. Or the functionality is available, but it is not yet documented.

One example where I ran into this were the new Environments, that can be used for supporting YAML pipelines. If you are working with tens or hundreds of pipelines, automation is key to doing so effectively so I needed that API!

To work with environments, three types of operations need to be available:

  1. Management (get, create, update, delete) of environment themselves;
  2. Management (get, add, remove) of user permissions on those environments;
  3. Management (get, add, remove) of checks on those environments. Checks are rules that are enforced on every deployment that goes into that environment.

The first type of operation has recently been made available in the preview of the next version of API and can be found here. However, managing user permissions or checks is not yet documented. For a recent project, I went ahead with reverse engineering these calls. In this post I will share how I reverse engineered managing user permissions on environments.

Disclaimer: this is al reverse engineered, so no guarantees whatsoever.

Tip: The approach outlined here works for many of the newer functionalities added to Azure DevOps, which seem to often use calls to URLs that start with _apis that are quite stable in my experience.

Managing user permissions

Finding the call for listing user permissions was rather straight forward. To get the API, I went through the following steps:

  1. Open the details of an environment and navigate to the security settings (visible on the left in the screenshot below);
  2. Next I opened up the developer tools, went to the network tab and filtered the list down to XHR requests only and refreshed the page (visible on the right in the screenshot below).

In the list of executed XHR requests, I selected the request that returns the different user permissions. I found this request by first looking at the request below it (roledefinitions), but quickly saw that this only listed the different roles and their names, descriptions and meaning. Inspecting the results visible on the far right will show the active permissions as JSON. I marked the corresponding sections left and right with different colors for the ease of reading.

The URL that was being called for this result was: https://dev.azure.com/azurespecialist/_apis/securityroles/scopes/distributedtask.environmentreferencerole/roleassignments/resources/b6f84576-4e8f-4754-b006-8bd4e735558a_1. Inspecting this URL in detail shows that the 1 at the end corresponds with the id of the environment as it is visible in the URL of the screenshot before. The guid in front of the environmentId took a bit more investigation, but after looking around for a bit, this came out to be the id of the project (formerly Team Project) that the environment is in. From here the call for listing the current user permissions on any environment can be generalized to:

GET https://dev.azure.com/{organizationName}/_apis/securityroles/scopes/distributedtask.environmentreferencerole/roleassignments/resources/{projectId}_{environmentId}

If you are not familiar with your project id(s), you can find those using a GET call to https://dev.azure.com/azurespecialist/_apis/projects.

Adding a user permission

Now that we can view the current set of permissions, let’s see if we can add a new user permission. To get the details of this operation, I did the following:

  1. Cleared the recent list of captured network operations;
  2. Make any change to the list on the left (note that there are no XHR requests being made);
  3. Press the save button in the user interface. This results in the following:

In this second screenshot we see that a PUT request has been made to https://dev.azure.com/azurespecialist/_apis/securityroles/scopes/distributedtask.environmentreferencerole/roleassignments/resources/b6f84576-4e8f-4754-b006-8bd4e735558a_1 with the following content:

[
  {
    "userId":"60aac053-6937-6e07-9a3f-296202a3dfff",
    "roleName":"Administrator"
  }
]

This shows that adding permissions can be done by PUTTING an entry to the same URL as we have seen before. The valid values for the  roleNames property are Administrator, Reader and User. (They can be retrieved and verified using the roledefinitions call we discovered earlier.) But what do we put in for the user id? To find the user id, we have to do two things.

  1. Look the user up using the Graph API
  2. Decode the user descriptor into the correct guid.

The graph API can be accessed through a GET call to https://vssps.dev.azure.com/azurespecialist/_apis/graph/users?api-version=5.1-preview.1, yielding the following response:

[
  {
    "subjectKind": "user",
    "directoryAlias": "henry",
    "domain": "c570bc0b-9ef3-4b15-98fc-9d7ca9b22afe",
    "principalName": "henry@azurespecialist.nl",
    "mailAddress": "henry@azurespecialist.nl",
    "origin": "aad",
    "originId": "186167cb-63ab-4ef9-a221-0398c9ab6bba",
    "displayName": "Henry Been",
    "_links": {
      "self": {
        "href": "https://vssps.dev.azure.com/azurespecialist/_apis/Graph/Users/aad.NjBhYWMwNTMtNjkzNy03ZTA3LTlhM2YtMjk2MjAyYTNkZmZm"
      },
      "memberships": {
        "href": "https://vssps.dev.azure.com/azurespecialist/_apis/Graph/Memberships/aad.NjBhYWMwNTMtNjkzNy03ZTA3LTlhM2YtMjk2MjAyYTNkZmZm"
      },
      "membershipState": {
        "href": "https://vssps.dev.azure.com/azurespecialist/_apis/Graph/MembershipStates/aad.NjBhYWMwNTMtNjkzNy03ZTA3LTlhM2YtMjk2MjAyYTNkZmZm"
      },
      "storageKey": {
        "href": "https://vssps.dev.azure.com/azurespecialist/_apis/Graph/StorageKeys/aad.NjBhYWMwNTMtNjkzNy03ZTA3LTlhM2YtMjk2MjAyYTNkZmZm"
      },
      "avatar": {
         "href": "https://dev.azure.com/azurespecialist/_apis/GraphProfile/MemberAvatars/aad.NjBhYWMwNTMtNjkzNy03ZTA3LTlhM2YtMjk2MjAyYTNkZmZm"
      }
    },
    "url": "https://vssps.dev.azure.com/azurespecialist/_apis/Graph/Users/aad.NjBhYWMwNTMtNjkzNy03ZTA3LTlhM2YtMjk2MjAyYTNkZmZm",
    "descriptor": "aad.NjBhYWMwNTMtNjkzNy03ZTA3LTlhM2YtMjk2MjAyYTNkZmZm"
  }
]

From this response we take the descriptor, strip of the prefix of aad. and BASE64 decode the remainder. This yields the guid we need.

Note: updating an entry is done the same way, the PUT operation acts as an upsert.

Deleting a user permission

Deleting user permissions can be done by making two changes:

  1. Sending a PATCH operation instead of an PUT
  2. Leaving out the roleName

Happy coding!

When the number of YAML pipelines you work with in Azure DevOps increases, you might find the need for centralizing some parts of the configuration variables for your pipeline(s). Maybe some configuration that is shared between multiple application components or even some values that are shared between multiple teams or managed by a central team.

To make this happen, you might be tempted to do either one of the following:

  1. Copy the configuration variables to every individual pipeline. The disadvantage of this is that you are now copying these values around and if one of them changes, this gives a lot of work and the risk of missing one or more of the necessary updates
  2. Use variable groups that you know from the Classic Build and Release definitions to manage central configuration. But if you do this, you loose some of the benefits of pipelines-as-code again.

Luckily there is now an alternative available, by combining some of the new YAML Pipelines features, namely variable templates and repository resources. In this post I want to share how I built a solution where configuration variables were centralized in one repository and used them from YAML pipelines in other repositories.

Let’s start by assuming that you have a number of pipelines, that all look somewhat like this:

pool:
  name: 'Azure Pipelines'
  vmImage: windows-latest

variables:
- allCompanyVariable: someValue
- allComponentsVariable: someValue

steps:
  - script: |
    echo $(allCompanyVariable)
    echo $(allComponentsVariable)

Of course the repetition is in these two variables and we want to centralize them out into some kind of configuration. To do this, I created a new repository named Shared-Configuration. In this repository I added a directory configuration with two files all-company.yml and my-department.yml, containing configuration values that need to be shared with multiple pipelines across multiple repositories.

These files are very straight forward and look like this:

variables:
  allCompanyVariable: someCompanyWideThingy
  foo: bar
To use these values, we have to update the dependent pipelines. First we have to add a repository resource declaration. Here we specify that we want to pull another Git repository into the scope of our builds and want to be able to reference files from it. We do this by adding the following YAML at the top of our pipeline:
resources:
  repositories:
  - repository: sharedConfigurationRepository
    type: git
    name: Shared-Configuration
This means that the repository Shared-Configuration is pulled into the scope of our pipeline and can be referenced using the identifier sharedConfigurationRepository. With that the repository is in scope, we can reference variable template files that are in this repository as follows:
variables:
- template: configuration/all-company.yml@sharedConfigurationRepository
- template: configuration/my-department.yml@sharedConfigurationRepository

Here we again declare variables, but instead of specifying key/value pairs we are now pulling in all variables from the referenced files. To do this, the full path to the file has to be specified along with a the identifier of the repository that holds this file. If the @-sign and the identifier are omitted, the path is assumed to be in the same repository as the pipeline definition.

Putting all of this together, the following syntax can be used for pulling variables defined in other, shared repositories into your YAML pipeline:

pool:
  name: 'Azure Pipelines'
  vmImage: windows-latest


resources:
  repositories:
  - repository: sharedConfigurationRepository
    type: git
    name: Shared-Configuration


variables:
- template: configuration/all-company.yml@sharedConfigurationRepository
- template: configuration/my-department.yml@sharedConfigurationRepository


steps:
- script: |
    echo $(allCompanyVariable)
    echo foo value is $(foo)


Happy coding!

Resources:

Many of my clients of lately have been working with naming conventions for all kinds of things. Some examples are Service Principals, Projects, AAD Groups, Azure resource groups, etc etc.

It seems that naming conventions have become an accepted -or even recommended- approach within many organizations. For some reason small groups of administrators enforce rules that might benefit them, but are holding thousands of other users back. And while I see a little merit in naming conventions from their point of view, I doubt that it is worth the trade-off. In this post I want to share some of the drawbacks of using naming conventions I have encountered.

Maybe we should reconsider doing this naming conventions thing?

Names become impossible to remember, work with or pronounce

A given Azure application can quickly span a number of components. An average resource group I work with has probably anywhere between ten and twenty resources in it. If three of these resources were databases, it is great if the team can refer to them using meaningful names. That is really hard if they are being called 3820-db-39820, 3820-db-399454 and 3820-db-730244. It makes any meaningful conversation impossible. Just imagine you are being called about the 39820 database, how do you even know what that is and what it does?

Having a customers database, a users database and an events database, it would be great to just name them customers, users and events. it makes any conversation about them much easier, removes noise, looking things up in source code or configuration and the work of the development team becomes much more fun. Imagine joining a team that runs five components with on average five teen resources, not pleasant at all.

I know it is a bloody database

And while we are on the topic of names like 3820-db-39820, everyone already knows it is a database. The team that created the database only deals with databases, so dûh! And the team itself can see it right next to the name:

User interfaces cannot deal with your overly long names

Another customer of mine had a naming convention for Azure resource groups. In my opinion quite ridiculous since every resource group is already in a subscription and those can in turn be organized into management groups. A great way for mimicking your organizational structure and seeing what a given resource group is about. So no need for calling them {businessunit}_{department}_{project}_{team}_{freetext} really. But of course some admins still do, delivering the following interface:

Trust me, no fun when you have to work with your resources the whole day. And this happens with many types of naming conventions. Here is another example, now using AAD groups that follow naming conventions.

With many naming conventions, many examples can be found in many different tools. Tools are simply not designed for displaying long, weird names that are supposed to encode all kinds of information. If you add in a bit more of duplication of information like resource type and resource location it becomes even worse.

How do you cope with changes?

Let’s assume two departments in your organization get merged. You now have two options:

  • Do you rename hundreds of resources?
  • Or do you leave hundreds of resources with deceiving names?

Your pick!

A hint: in many tools and systems you cannot change the name of a resource after creation.

Behavior gets attached

Now let’s switch from things that are just annoying to things that can be potentially dangerous. Just for fun, ever tried calling your new App Service not appsrv_{meaningfullname} but db_{meaningfullname}? I bet there will be one or two administrative scripts breaking soon after.

Another problem I just recently encountered is that of conflicting conventions. At one customer all Azure resource groups were prefixed with a certain identifier for the team name, let’s stay team-{number}. For example,  team-0125 and team-5578. This had been going on for a while and more and more dependencies were taken on that convention. One team for example allowed for requesting new pre-configured databases and then automatically added that to the correct resource group based on the team number. A second team scanned all resources and calculated internal cost allocations based on the name of the resource group, etc etc. A few months after establishing the convention and adding all this behavior on top of it, a new off the shelve application was purchased. The team that bought this application had only one request though, and that is if some of the resource groups it should target could start with module-.

Uh-oh!

Implicit assumptions all around

One thing I have learned to not underestimate is the amount of reverse-engineering going on within organizations. If I name my resourcegroups {projectnumber}-{somethingusefull}, and I don’t tell that the first part is a project number, or folks don’t listen, all kinds of assumptions can start to arise. Imagine that there are also cost centers that most of the time have the same number as the project that they belong to.

Mixing in some attached behavior and confusion will quickly lead to errors. The things that can go wrong when automation teams start their work on the assumption that the first part of any resource group name is the cost center…

There are better approaches

The real problem, in my opinion, is that the names of resources, groups or things are not meant for encoding all sorts of information. And in reality, you don’t have to either.

More and more systems now provide the means for storing extra information with a resource. For example Azure supports adding tags to your resources. It is as simple as adding key/value pairs with descriptive, well-formatted, not abbreviated names. With recent changes to the Azure Portal, you can now even have them render in your lists. As an added benefit, tags are also easy to remove, add, rename and correct. Giving administrators all the information they need, without needing to burden users with long names:

Active Directory for example supports extension attributes. And of course, if tags are not supported demand that they be added to the system you are using. Try to push for the correct solution, instead of trying to work around the issue.

As a conclusion, I have learned that naming conventions have downsides even though they seem to be an accepted practice within many companies. While they may bring value, I really hope this can serve as a reminder for myself and a warning for others when they think it is smart to introduce. Let’s try to not be that person that forces hundreds or thousands of colleagues into some structure that really hinders them, only for our own convenience.

And if we really have to use naming conventions, can we please have the least significant part of an naming convention first? {team}-{department}-{businessUnit} will at least solve most of the everyday problems of the impacted users.

One of the elements of ARM templates that is often overlooked is the capability to write your own functions. The syntax for writing functions in JSON can be a bit cumbersome, especially when comparing to full programming languages, but they can really help to make your ARM templates more readable.

Here is an example that I use in my own ARM templates:

"functions": [
    {
      "namespace": "hb",
      "members": {
        "createKeyVaultReference": {
          "parameters": [
            {
              "name": "keyVaultName",
              "type": "string"
            },
            {
              "name": "secretName",
              "type": "string"
            }
          ],
          "output": {
            "type": "string",
            "value": "[concat('@Microsoft.KeyVault(SecretUri=https://', parameters('keyVaultName'), '.vault.azure.net/secrets/', parameters('secretName'), '/)')]"
          }
        }
      }
    }
  ]

In my templates I frequently use the @Microsoft.KeyVault syntax for AppSettings to reference settings in the Key Vault. It is a very secure and convenient way for working with application secrets. The only downside isthat you have to remember the complete syntax for this notation every single time and have to remember to not forget the trailing slash. That last thing is a mistake that I see frequently. Using a function like this, we can now encode that knowledge in one location and reuse it throughout our template.

After the declaration above, we can invoke this function by prefixing the function name with the name of the function namespace and a dot. So calling the function declared above requires an invocation of hb.createKeyVaultReference:

{
    "name": "appsettings",
    "type": "config",
    "apiVersion": "2015-08-01",
    "dependsOn": [
        "[variables('functionsAppServiceName')]"
    ],
    "properties": {
        "someSetting": "[hb.createKeyVaultReference(variables('keyVaultName'), 'someSetting')]"
    }
}

Here the clutter of concatenating the different parts of the @Microsoft.KeyVault reference string is now removed and the knowledge on how to built that string is moved into one single location, ready for reuse by anyone.

Resources:

  • https://docs.microsoft.com/en-us/azure/azure-resource-manager/templates/template-syntax#functions
  • https://docs.microsoft.com/en-us/azure/azure-resource-manager/templates/template-user-defined-functions

A while ago I wrote about how to retrieve configuration settings for an Azure Function App from the Key Vault. This approach had the benefit that settings are loaded early enough in the start-up procedure, to also be available to retrieve configuration settings for function bindings.

Unfortunately, this approach also has a number of downsides:

  • Lately, I have been running into intermittent issues with this approach lately. In some cases the settings failed to load from the Key Vault in time, resulting in start-up errors of the Function App. These are not only annoying, but can also be hard to troubleshoot.
  • The workaround to only load the settings when a Managed Identity is available and not when running locally, is not so clean. Next to being not clean, it also makes for a difference in behavior between running locally and deployed. A possible source of issues.
  • The app configuration in the portal (or better: in your ARM template) does not list all the settings the application uses. One of more of them are being side-loaded from the Key Vault. This makes that it is less transparent for new members of the team which settings the application really needs.

Luckily, a new approach to loading secrets from an Azure Key Vault has become available. As an setting configuration you can now specify a reference to an Key Vault secret using the following syntax:

@Microsoft.KeyVault(SecretUri=https://<keyvaultname>.vault.azure.net/secrets/<secretname>/)

Please note the slash at the end! This slash is mandatory to reference the last version of the secret. Optionally, you can specify a specific version by specifying it after the slash. Leaving the slash completely out, makes that the reference will not work.

Now whenever this syntax is encountered by the App Service runtime as a setting, it will automatically use your App Services Managed Identity to retrieve the secret from the Key Vault (just as my previous solution did that in user code). In the portal you can even track the status of this look-up, where it is displayed as successful or not:

Of course this syntax can also be used in ARM templates and I have moved almost all my applications over to this approach now. An example of the syntax for ARM templates is as follows:

{
  "apiVersion": "2015-08-01",
  "name": "appsettings",
  "type": "config",
  "dependsOn": [
    "[variables('functionsAppName')]",
    "[variables('secretName')]"
  ],
  "properties": {
    "AuditDbConnectionString": "[concat('@Microsoft.KeyVault(SecretUri=https://', variables('keyVaultName'), '.vault.azure.net/secrets/', variables('secretName'), '/)')]"
  }
}

I hope you enjoy this new feature as much as I do and happy coding! 🙂

There is no place like home, and also: there is no place like production. Production is the only location where your code is really put to the test by your users. This insight has helped developers to accept that we have to go to production fast and often. But we also want to do so in a responsible way. Common tactics for safely going to production often are for example blue-green deployments and the use of feature flags.

While helping to limit the impact of mistakes, the downside of these two approaches is that they both run only one version of your code. Either by using a different binary or by using a different code path, the one or the other implementation is executed. But what if we could execute both the old and the new code in parallel and compare the results? In this post I will show you how to run two algorithms in parallel and compare the results, using a library called scientist.net, which is available on NuGet.

The use case

To experiment a bit met experimentation I have created a straight forward site for calculation the nth position in the Fibonacci sequence as you can see below.

I started out with the most simple implementation that seemed to meet the requirements of the implementation. In other words, the implementation behind this calculation is done using recursion, like shown below.

public class RecursiveFibonacciCalculator : IRecursiveFibonacciCalculator
{
  public Task<int> CalculateAsync(int position)
  {
    return Task.FromResult(InnerCalculate(position));
  }

  private int InnerCalculate(int position)
  {
    if (position < 1)
    {
      return 0;
    }
    if (position == 1)
    {
      return 1;
    }

    return InnerCalculate(position - 1) + InnerCalculate(position - 2);
  }
}

While this is a very clean and to-the-point implementation code wise, the performance is -to say the least- up for improvement. So I took a few more minutes and I came up with an implementation which I believe is also correct, but also much more performant, namely the following:

public class LinearFibonacciCalculator : ILinearFibonacciCalculator
{
  public Task<int> CalculateAsync(int position)
  {
    var results = new int[position + 1];

    results[0] = 0;
    results[1] = 1;

    for (var i = 2; i <= position; i++)
    {
      results[i] = results[i - 1] + results[i - 2];
    }

    return Task.FromResult(results[position]);
  }
}

However, just swapping implementations and releasing didn’t feel good to me, so I thought: how about running an experiment on this?

The experiment

With the experiment that I am going to run, I want to achieve the following goals:

  • On every user request, run both my recursive and my linear implementation.
  • To the user I want to return the recursive implementation, which I know to be correct
  • While doing this, I want to record:
    • If the linear implementation yields the same results
    • Any performance differences.

To do this, I installed the Scientist NuGet package and added the code shown below as my new implementation.

public async Task OnPost()
{
  HasResult = true;
  Position = FibonacciInput.Position;

  Result = await Scientist.ScienceAsync<int>("fibonacci-implementation", experiment =>
  {
    experiment.Use(async () => await _recursiveFibonacciCalculator.CalculateAsync(Position));
    experiment.Try(async () => await _linearFibonacciCalculator.CalculateAsync(Position));

    experiment.AddContext("Position", Position);
  });
}

This code calls into the Scientist functionality and sets up an experiment with the name fibonacci-implementation that should return an int. The configuration of the experiment is done using the calls to Use(..) and Try(..)

Use(..): The use method is called with a lambda that should execute the known, trusted implementation of the code that you are experimenting with.

Try(..): The try method is called with another lambda, but now the one with the new, not yet verified implementation of the algorithm.

Both the Use(..) and Try(..) method accept a sync-lambda as well, but I do use async/await here on purpose. The advantage of using an async-lambda is that both implementations will be executed in parallel, thus reducing the duration of the web server call. The final thing I do with the call to the AddContext(..) method is adding a named value to the experiment. I can use this context property-bag later on to interpret the results and to pin down scenarios in which the new implementation is lacking.

Processing the runs

While the code above takes care of running two implementations of the Fibonacci sequence in parallel, I am not working with the results yet – so let’s change that. Results can be redirected to an implementation of the IResultPublisher interface that ships with Scientist by assigning an instance to the static ResultPublisher property as I do in my StartUp class.

var resultsPublisher = new ExperimentResultPublisher();
Scientist.ResultPublisher = resultsPublisher;

In the ExperimentResultPublisher class, I have added the code below.

public class ExperimentResultPublisher : IResultPublisher, IExperimentResultsGetter
{
  public LastResults LastResults { get; private set; }
  public OverallResults OverallResults { get; } = new OverallResults();

  public Task Publish<T, TClean>(Result<T, TClean> result)
  {
    if (result.ExperimentName == "fibonacci-implementation")
    {
      LastResults = new LastResults(! result.Mismatched, result.Control.Duration, result.Candidates.Single().Duration);
      OverallResults.Accumulate(LastResults);
    }

    return Task.CompletedTask;
  }
}

For all instances of the fibonacci-implementation experiment, I am saving the results of the last observation. Observation is the Scientist term for a single execution of the experiment. Once I have moved the results over to my own class LastResults, I am adding these last results to another class of my own OverallResults that calculated the minimum, maximum and average for each algorithm.

The LastResults and OverallResults properties are part of the IExperimentResultsGetter interface, which I later on inject in my Razor page.

Results

All of the above, combined with some HTML, will then gave me the following results after a number of experiments.

I hope you can see here how you can take this forward and extract more meaningful information from this type of experimentation. One thing that I would highly recommend is finding all observations where the existing and new implementation do not match and logging a critical error from your application.

Just imagine how you can have your users iterate and verify all your test cases, without them ever knowing.